Detect Under- and Over- Reporting of Clinical Events in Clinical Trials with simaerep 1.0.0
Detect Under- and Over- Reporting of Clinical Events in Clinical Trials with simaerep 0.6.0
Detect Under-Reporting of Adverse Events in Clinical Trials with simaerep 0.5.0
Create
plotly.js Parallel Categories Diagrams Using this Htmlwidget and easyalluvial
Notes when going through advanced R - Metaprogramming
Notes when going through advanced R
Quality Control with R - Notes

Quality Control with R - Notes

Detect Under-Reporting of Adverse Events in Clinical Trials
Minor Release, maintains compatibility with
dplyr 1.0.0 and now has a slick pkgdown documentation website and makes better use of Travis CI using multiple builds to ensure compatibilty with package dependencies.
Create
plotly.js Parallel Categories Diagrams Using this Htmlwidget and easyalluvial
Minor Release, maintains compatibility with
tidyr 1.0.0 and a few bug fixes.
Europython 2019 Conference Notes

Use easyalluvial for visualising model response in up to 4 dimensions.
Mayor Release for easyalluvial with exciting new features. Visualise model response using 4 dimensional partial dependence plots and add marginal histograms to visualise distribution of binned numerical values.
A preview on the tidymodels meta package

Efficiently explore categorical data in dataframes
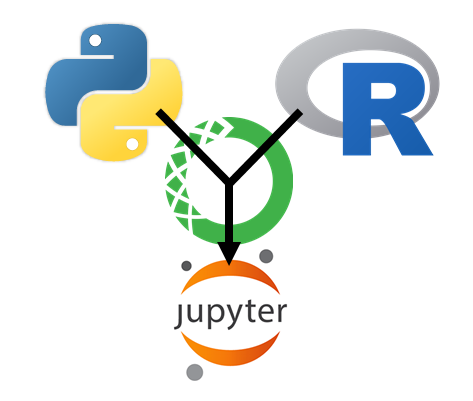
There has been a lot of fuzz about jupyter notebooks lately, so lets revisit some of its features and use-cases.
We demonstrate how we can use R from within a python jupyter notebook using rpy2 including R html widgets
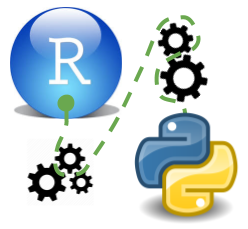
Here we give a step-by-step tutorial on how to manage R and python packages with conda.
We give an introduction to conda environments and show how they can be used to maintain reproducibility in polyglot data projects using both R and python.
We look into some techniques for scikitlearn that allow us to write more generalizable code that executes faster and helps us to avoid numpy arrays.
We look into some techniques for scikitlearn that allow us to write more generalizable code that executes faster and helps us to avoid numpy arrays.
We take scikitlearn for a spin, and try out the whole modelling workflow.
We look at the plotly API for R and python